UHF Partial Discharge Condition Monitoring in Saudi Arabia: 24/7 Online Protection to Enhance Switchgear Reliability and Prevent Failures
Partial discharge (PD) is one of the most dangerous and least understood threats inside medium- and high-voltage switchgear. It begins invisibly—inside microscopic voids that no inspection can detect—and progresses silently until a catastrophic failure occurs.
In Saudi Arabia, with aging infrastructure and extreme operating conditions, continuous UHF PD monitoring is no longer optional. It is essential.
This article explains why, shows how PD progresses, and presents the OSENSA + Petrozone solution designed specifically for Saudi industries.
Executive Summary
The Hidden Threat: Partial discharge silently destroys switchgear insulation over months or years, starting from microscopic voids invisible to inspections. By the time you see symptoms, failure is imminent.
The Problem: Traditional testing methods miss 90% of developing faults. Periodic inspections only capture snapshots. Offline testing requires costly shutdowns.
The Solution: Continuous UHF monitoring detects insulation degradation months or years before failure, enabling predictive maintenance that prevents unplanned outages costing millions in lost production.
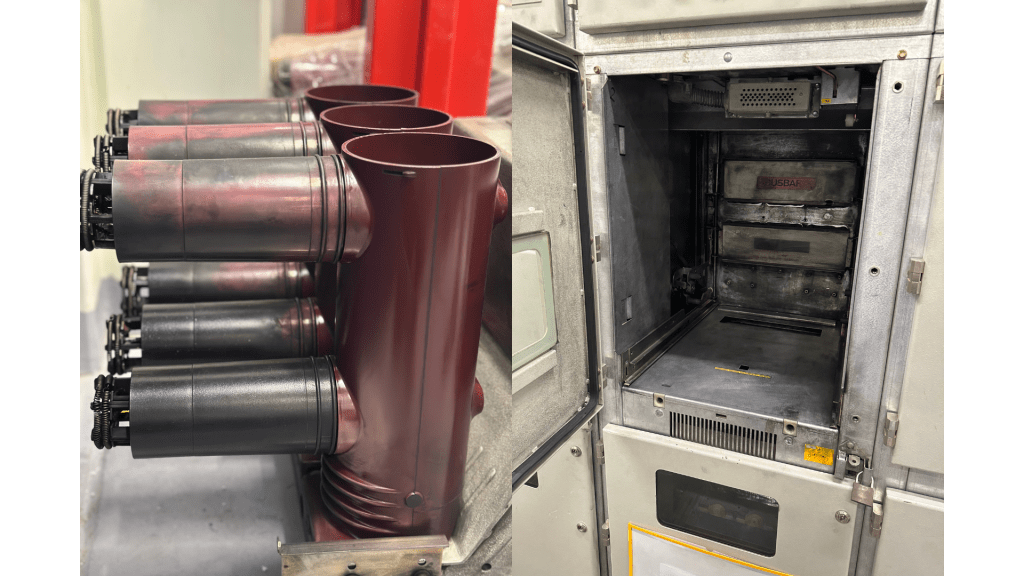
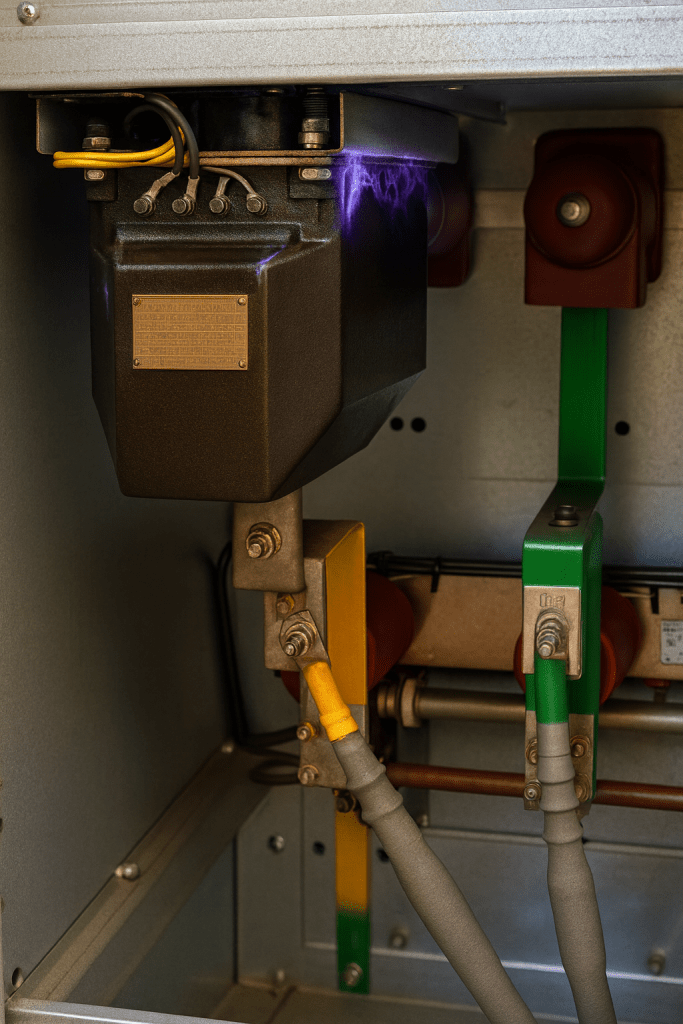
The Flashover That Should Never Have Happened
Picture this: A routine Tuesday morning at a major industrial facility in Saudi Arabia. No warnings. No alarms. Just a sudden, violent flashover inside a circuit breaker compartment—arc flash, smoke, emergency shutdown. Production halted. Investigations launched. Losses mounting by the hour.
The culprit? Not a manufacturing defect. Not operator error. Not even a power surge.
It was Partial Discharge—a silent assassin that had been slowly killing the insulation for months, maybe years, completely undetected.
The question that haunts every facility manager: How many of your switchgears are quietly dying right now?
A switchgear compartment after a flashover—carbonized surfaces reveal months of undetected partial discharge leading to sudden failure
Why This Matters NOW ?
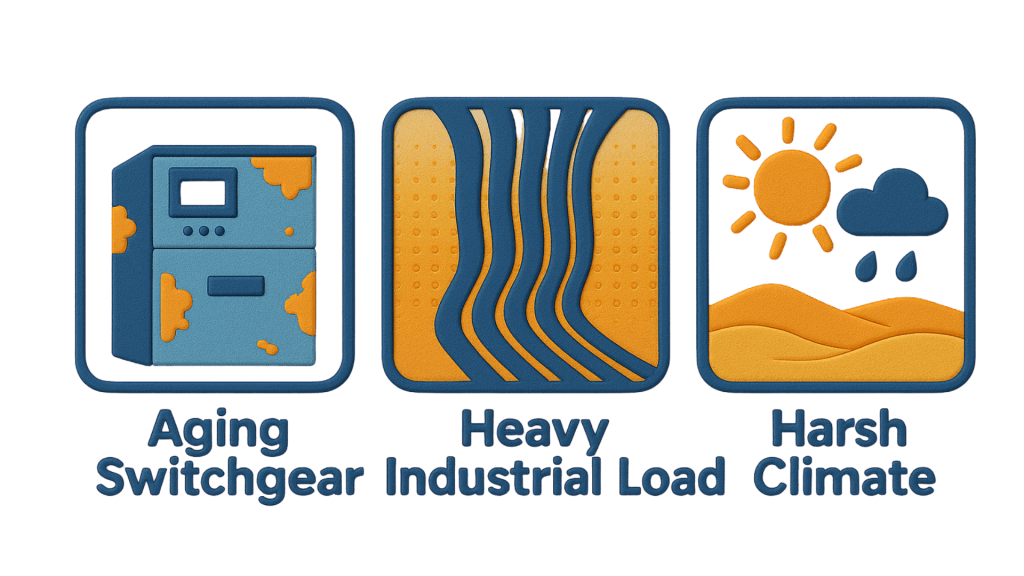
Three converging factors make PD monitoring urgent for Saudi facilities:
Infrastructure Age: Most of Saudi Arabia’s industrial electrical systems were installed during the 1980s-90s expansion. That equipment is now 25-40 years old—well into the high-risk failure zone.
Increased Loading: Production demands have increased 30-50% beyond original design capacity. Higher currents = more heat = accelerated insulation aging.
Harsh Environment: Saudi Arabia’s unique climate (50°C+ summer heat, coastal humidity, desert dust) creates the perfect storm for insulation degradation:
Without continuous monitoring, you’re operating blind during the highest-risk period in your equipment’s lifecycle.
The Story Your Insulation Doesn't Want You to Know
Act 1: The Invisible Beginning (The Air Void)
Every insulation failure starts with something you cannot see—a microscopic air pocket, barely a fraction of a millimeter wide, trapped inside the insulation material during manufacturing. Or perhaps it forms later, created by:
Thermal cycling as equipment heats and cools through Saudi Arabia’s extreme temperature swings
Mechanical stress from vibrations and switching operations
Chemical aging as insulation materials degrade over decades
Moisture ingress in coastal regions like Jubail or Yanbu
A microscopic air void hidden inside insulation—the silent starting point of almost every partial discharge failure.
Timeline Alert: This stage can exist for years without consequence. The clock starts ticking when voltage is applied.
Act 2: The First Spark (Partial Discharge Ignition)
When voltage is applied across the insulation, the electric field concentrates at the void. During peak AC voltage cycles, the electric field strength inside that tiny air pocket exceeds the breakdown strength of air (approximately 3 kV/mm).
CRACK!
A microscopic spark jumps across the void. It’s called “partial” discharge because it doesn’t bridge the entire insulation gap—just that small cavity. The discharge lasts microseconds and releases only picocoulombs (pC) of charge.
You can’t see it. You can’t hear it. Your protection relays don’t trip. But it happens 50 or 60 times per second (depending on your AC frequency), every single cycle, relentlessly.
What happens during each discharge: A tiny plasma channel forms. Temperatures reach thousands of degrees Celsius momentarily. Chemical bonds in the insulation break down. Carbon residue deposits on the void walls. The void surface becomes slightly conductive.
This is the moment PD starts: a tiny spark inside a void that no sensor or relay can detect—until it grows.
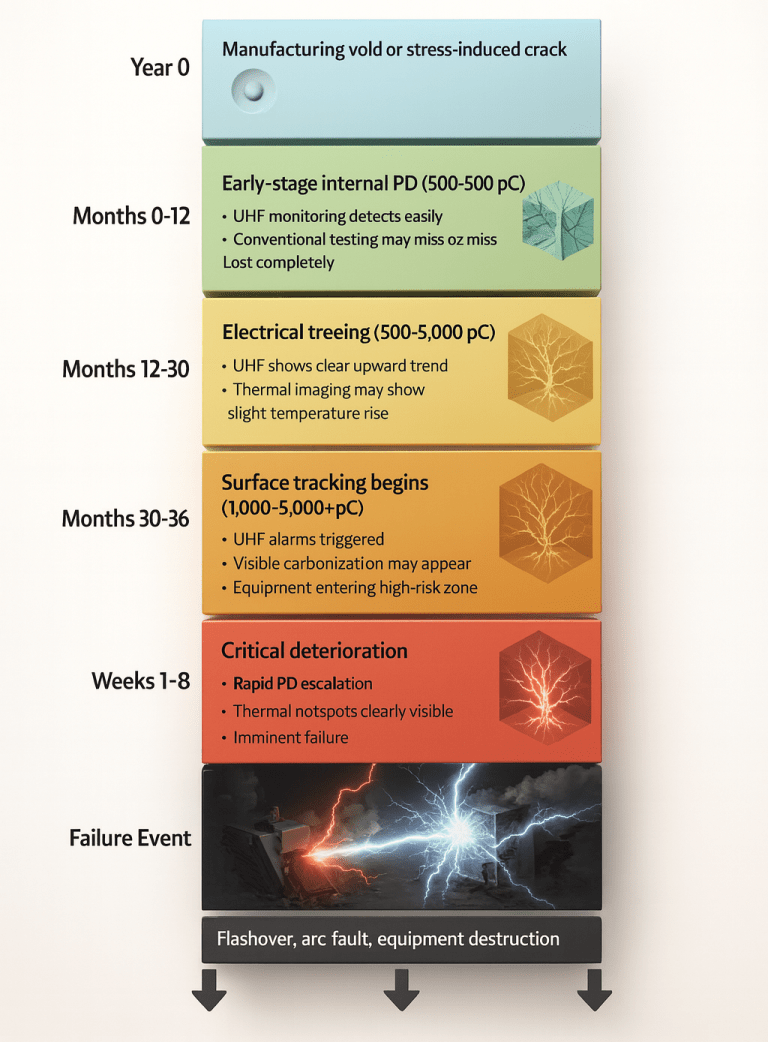
Timeline Alert: Early-stage PD (50-200 pC) can continue for 6-18 months before progressing. This is your golden window for detection and intervention.
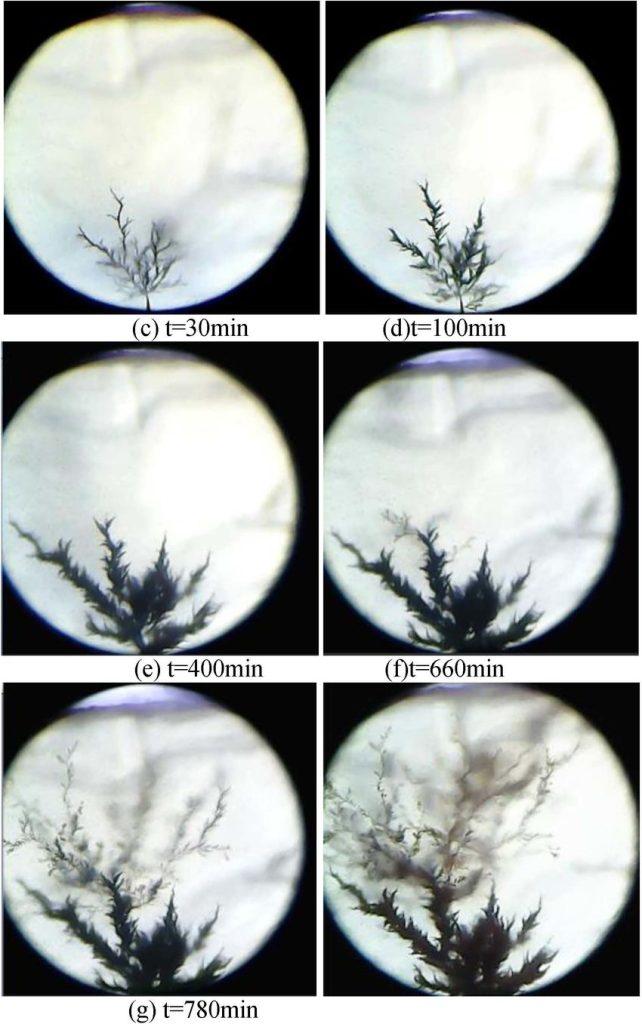
Act 3: The Tree Begins to Grow (Electrical Treeing)
With each discharge, the carbonized residue makes the next discharge easier. The damaged area grows. What started as a spherical void now extends fingerlike projections—electrical trees—branching through the insulation like roots searching for soil.
These trees follow the path of least resistance, growing primarily along the direction of the electric field. The process accelerates because carbon is conductive and lowers local insulation resistance, more surface area creates more discharge sites, chemical degradation weakens surrounding material, and moisture absorption occurs as carbonized areas attract humidity.
In Saudi Arabia’s environment, this is particularly dangerous. Desert dust settles on equipment, increasing surface contamination. High humidity in coastal areas accelerates chemical breakdown. Temperature extremes (50°C+ ambient in summer) stress insulation bonds. Frequent switching operations in industrial facilities create repetitive voltage stress.
Electrical treeing grows rapidly inside insulation—branching like roots as repeated PD strikes carbonize and weaken the material
Timeline Alert: Tree propagation typically takes 6-24 months. PD magnitude increases to 500-2,000 pC. Still detectable and preventable, but the window is closing.
Act 4: The Point of No Return (Surface Tracking)
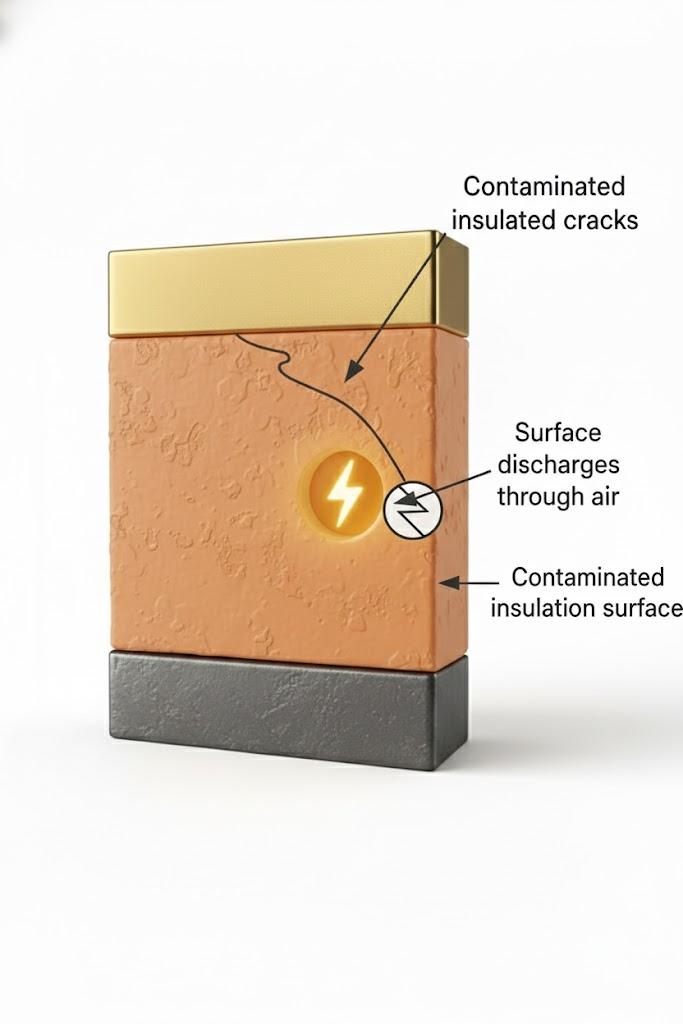
The electrical tree eventually reaches the insulation surface. Now you have a new problem: surface discharge.
Where internal PD was confined to voids, surface discharge can track across contaminated insulation surfaces, especially in the presence of conductive dust particles, salt deposits (in coastal substations), industrial chemical residues, and moisture films.
The discharge intensity increases dramatically. What started at 50-200 pC may now reach 1,000-5,000 pC or higher. The PD frequency increases. The phase-resolved pattern changes from internal corona to surface tracking signatures.
At this stage, you’re racing against time. Failure could happen in weeks or even days.
Once electrical treeing reaches the surface, PD begins to track across contaminated insulation—rapidly accelerating the path toward failure
A real example of surface discharge inside switchgear: contamination and stress create visible tracking paths that indicate imminent insulation breakdown.
Timeline Alert: Surface tracking to failure: 2-12 weeks. If you’re seeing visible damage or thermal anomalies, the equipment is already in critical condition.
Act 5: The Final Breakdown (Catastrophic Failure)
The insulation is now so degraded that it can no longer withstand the operating voltage. One of these scenarios unfolds:
Scenario A: Flashover — Complete arc bridges the insulation gap, causing immediate short circuit, arc flash, equipment damage, and potential fire.
Scenario B: Tracking Failure — Carbon path becomes fully conductive, creating a continuous short circuit to ground or between phases.
The result is always the same: Unplanned shutdown. Equipment damage or destruction. Production losses (potentially millions of SAR per day). Safety risks to personnel. Extended downtime for repairs/replacement. Regulatory investigations.
Key Insight: The entire journey from void to failure typically spans 24-48 months. UHF monitoring catches it in the first 6-18 months. Traditional methods often detect it only in the final 2-8 weeks—when it’s too late to prevent downtime.
The Million-Riyal Question: Could You Have Prevented It?
The answer is YES—but only if you were monitoring.
Here’s the brutal truth about traditional maintenance approaches:
Periodic Inspections Miss 90% of PD Activity. Your technician visits every 6-12 months, performs visual inspection, thermography, maybe some manual testing. But PD happens continuously, 24/7. What are the chances that failure indicators appear exactly during your inspection window?
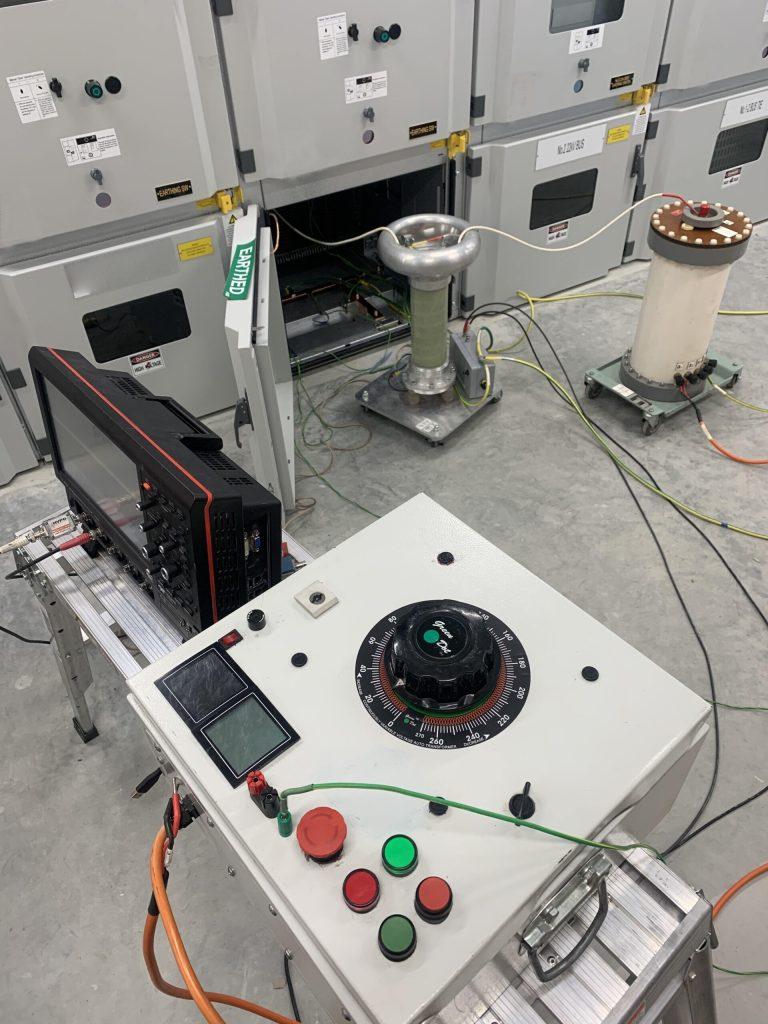
Offline PD Testing is Impractical. IEC 60270 testing requires complete shutdown (unacceptable for critical facilities), de-energization and isolation, direct electrical connections (intrusive, labor-intensive), and a controlled lab environment (impossible in operating substations). Plus, offline testing only gives you a snapshot of that exact moment—it can’t tell you if PD is worsening or stable.
Waiting for Symptoms is Too Late. By the time you see visible damage, thermal hotspots, or unusual readings on protection relays, the insulation is already critically compromised. You’re not preventing failure—you’re just documenting it before it happens.
Offline PD testing requires bulky, high-voltage equipment—and complete shutdowns that most facilities cannot afford.
Traditional offline tests expose switchgear, interrupt operations, and still provide only a snapshot—not continuous visibility into PD activity.
Imagine if you could hear the whispers before the scream—detect those microscopic sparks while they’re still in the void stage, long before electrical trees form.
That’s exactly what Ultra-High Frequency (UHF) Partial Discharge Monitoring does.
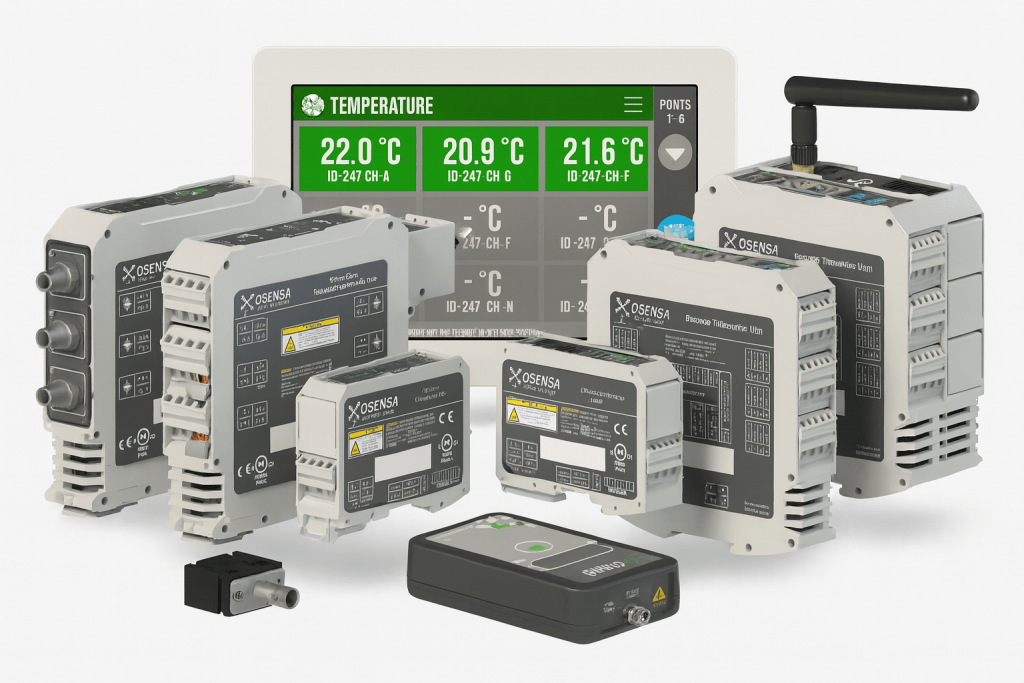
OSENSA’s UHF monitoring ecosystem—sensors, processors, and thermal modules working together to detect PD at its earliest stage
Why UHF Technology Changes Everything
The Physics Behind It
Every partial discharge generates electromagnetic radiation across a wide spectrum. While traditional PD methods listen only to low-frequency electrical signals, OSENSA’s UHF sensors capture high-frequency PD signatures between 400 MHz and 1600 MHz.
This frequency band is intentionally selected because:
It avoids industrial electromagnetic noise
It is ideal for detecting PD inside metal-clad switchgear
It provides cleaner, sharper PD pulses for earlier detection
Unlike generic UHF systems that use one wideband antenna, OSENSA uses four precision-tuned RF antennas, each optimized to detect PD signatures within specific sub-bands of the UHF spectrum
UHF detection changes the game by measuring the electromagnetic “fingerprint” of PD instead of the charge.
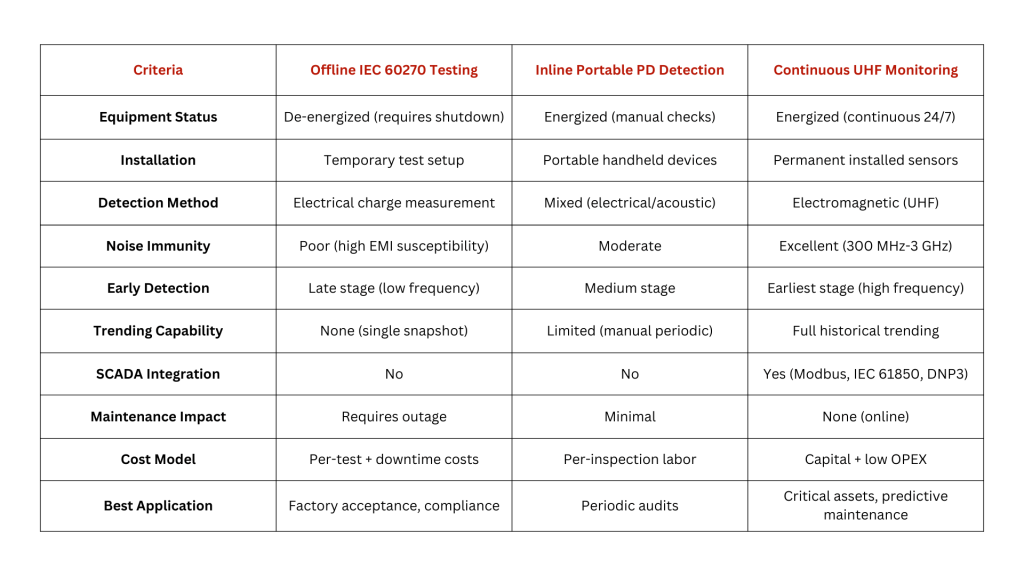
Technical Comparison: Why UHF Wins
Bottom line: For continuous reliability monitoring of critical assets, UHF is the only practical solution.
The OSENSA +
Petrozone Solution: World-Class Technology Meets Local Expertise
About OSENSA Innovations
OSENSA Innovations is a Canadian-based global leader in advanced UHF partial discharge monitoring technology, delivering high-precision solutions for early detection of insulation degradation. With proven installations across North America, Europe, Asia, and the Middle East, OSENSA safeguards mission-critical electrical assets in some of the world’s most demanding industrial environments.
Protected Equipment:
Protected Equipment
OSENSA’s UHF monitoring systems are designed for a wide range of medium- and high-voltage equipment, including:
Medium & High Voltage Switchgear (AIS & GIS)
Ring Main Units (RMUs)
Dry-Type and Oil-Filled Transformers
Bus Ducts and Cable Systems
Cable Terminations and Joints
Key Technology Advantages
Four Precision-Tuned RF Antennas (400–1600 MHz): Enhanced sensitivity, noise rejection, and early-stage PD detection.
Ultra-High Sensitivity: Detects PD as low as 50 pC for true early warning.
Humidity-Integrated Diagnostics:Reduces false alarms by correlating PD with environmental conditions.
Phase-Synchronized Analysis: Aligns PD pulses with the AC cycle to reveal source, severity, and fault pattern.
Automatic Data Logging + OsensaView: Exports trends, events, and cloud plots for deeper diagnostics and maintenance planning.
Scalable System Architecture: Supports up to 48 sensors, ideal for large or complex installations.
Open Communication Protocols: Modbus RTU/TCP, IEC 61850, and DNP3 for seamless SCADA/DCS integration.
Maintenance-Free Operation: Sensors operate for 20+ years with no recalibration required.
About Petrozone International
Petrozone International is OSENSA’s exclusive authorized representative and service agent in Saudi Arabia, delivering complete turnkey solutions from assessment to long-term support.
Complete Project Delivery:
Supply & Procurement: Genuine OSENSA products with full manufacturer warranty
Professional Installation: Certified technicians experienced in GIS, AIS, RMU, and transformer applications
Commissioning & Testing: Baseline establishment, system validation, and performance verification
SCADA Integration: Seamless connection to DCS, SCADA, and asset management platforms
Training & Knowledge Transfer: Comprehensive on-site training for operations and maintenance teams
After-Sales Support: Technical support, troubleshooting, preventive maintenance, and spare parts management
Retrofit Solutions: Upgrade aging equipment without costly replacement
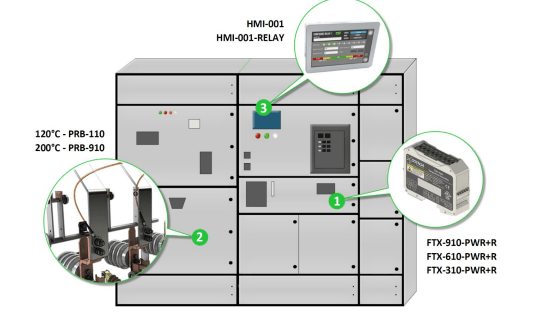
The Technology Stack: How It Works
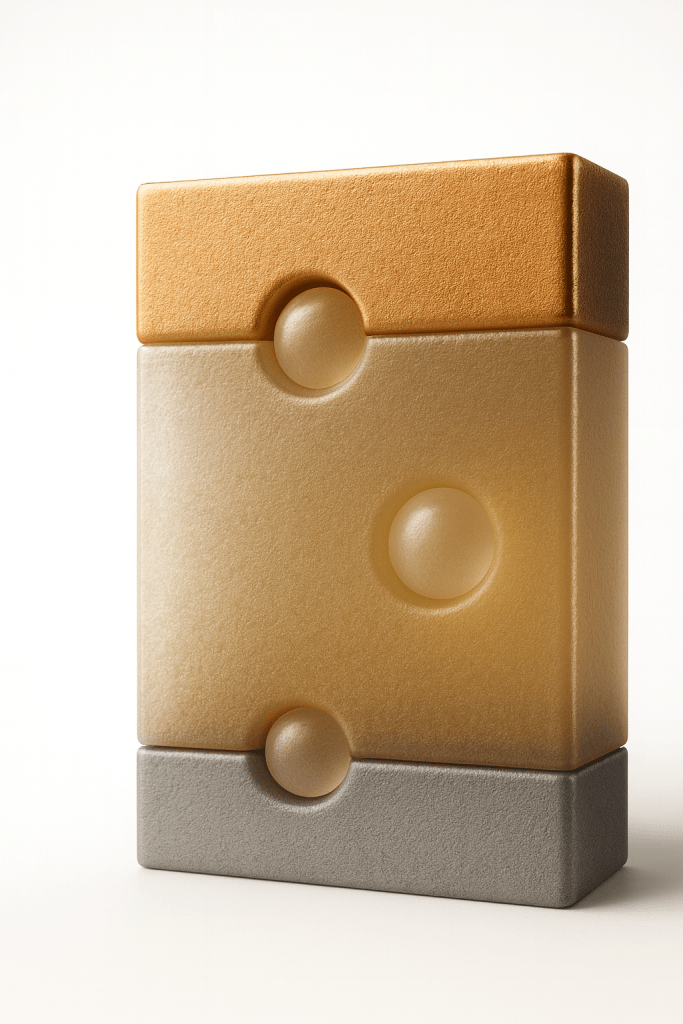
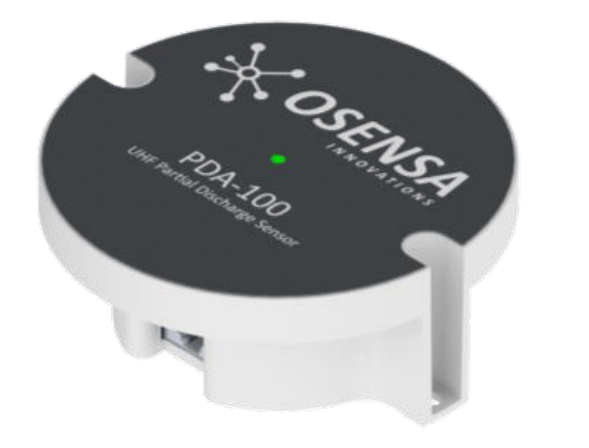
1. PDA-100 UHF Smart Sensors
These are the “ears” of the system—ultra-sensitive antennas that detect electromagnetic bursts from PD activity.
The PDA-100 sensors use four precision RF antennas, each optimized for a specific portion of the 400–1600 MHz band. This architecture provides:
Higher sensitivity
Better rejection of industrial noise
Accurate detection of both weak early-stage PD and strong late-stage PD
They also include built-in humidity sensing, which allows the system to automatically adjust thresholds and avoid false alarms during environmental changes.
Installation: Mounted inside switchgear compartments (busbar, cable, CB sections). Each compartment acts as a Faraday cage requiring a dedicated sensor. External mounting with magnetic or bolt-on brackets.
A compact UHF sensor engineered with four-band RF detection for maximum sensitivity across the 400–1600 MHz spectrum
2. PDX-800 UHF Monitor
The PDX-800 is the brain of the UHF monitoring system. It receives signals from up to 8 UHF sensors and analyzes them in real time to detect and trend partial discharge activity.
What the PDX-800 Does
Performs high-speed sampling and FFT analysis
Synchronizes PD signals with the 50/60 Hz AC cycle
Generates real-time PRPD cloud plots for identifying PD type
Calculates Peak PD (strongest discharge per cycle)
Calculates Total PD (overall activity level)
Records temperature and humidity for automatic correlation
Mounts directly on a DIN rail for easy integration
Why It Matters
The combination of real-time cloud plots, humidity correlation, and fault-pattern recognition helps technicians quickly understand:
What type of PD is developing
How fast it is progressing
Whether it is caused by environmental conditions or insulation failure
In short, the PDX-800 turns raw UHF signals into clear, actionable insights, making early diagnosis faster and more accurate
PDX-800: A high-speed UHF analyzer that synchronizes with AC cycles, calculates peak and total PD, and supports advanced pattern recognition
3. HMI-001 Relay Display
he HMI-001 is the user-friendly touchscreen interface for the entire PD monitoring system. It provides clear visualization, trending, alarms, and integration with plant SCADA/DCS.
What the HMI-001 Allows You To Do
View real-time PRPD cloud plots
Capture and download cloud plots for reporting
Export event logs and PD snapshots
Import data into OsensaView for deeper analysis
Monitor temperature, humidity, and PD levels in one place
Track PD trends over days, weeks, or months
Key Features
Supports up to 40 PD sensors, 99 temperature sensors, and 36 auxiliary inputs
Dual-threshold alarms (Warning / Critical)
9 configurable relay outputs for alarms or trips
Ethernet + USB/FTP/SSH data export
SCADA-ready with support for Modbus TCP/IP, IEC 61850, and DNP3
Why It Matters
With clear visuals and fast data access, maintenance teams can easily understand:
How PD is evolving
Whether fault patterns indicate voids, tracking, corona, or treeing
How environmental conditions (humidity/temperature) influence PD
When intervention is needed
This reduces troubleshooting time, improves decision-making, and helps prevent unexpected failures.
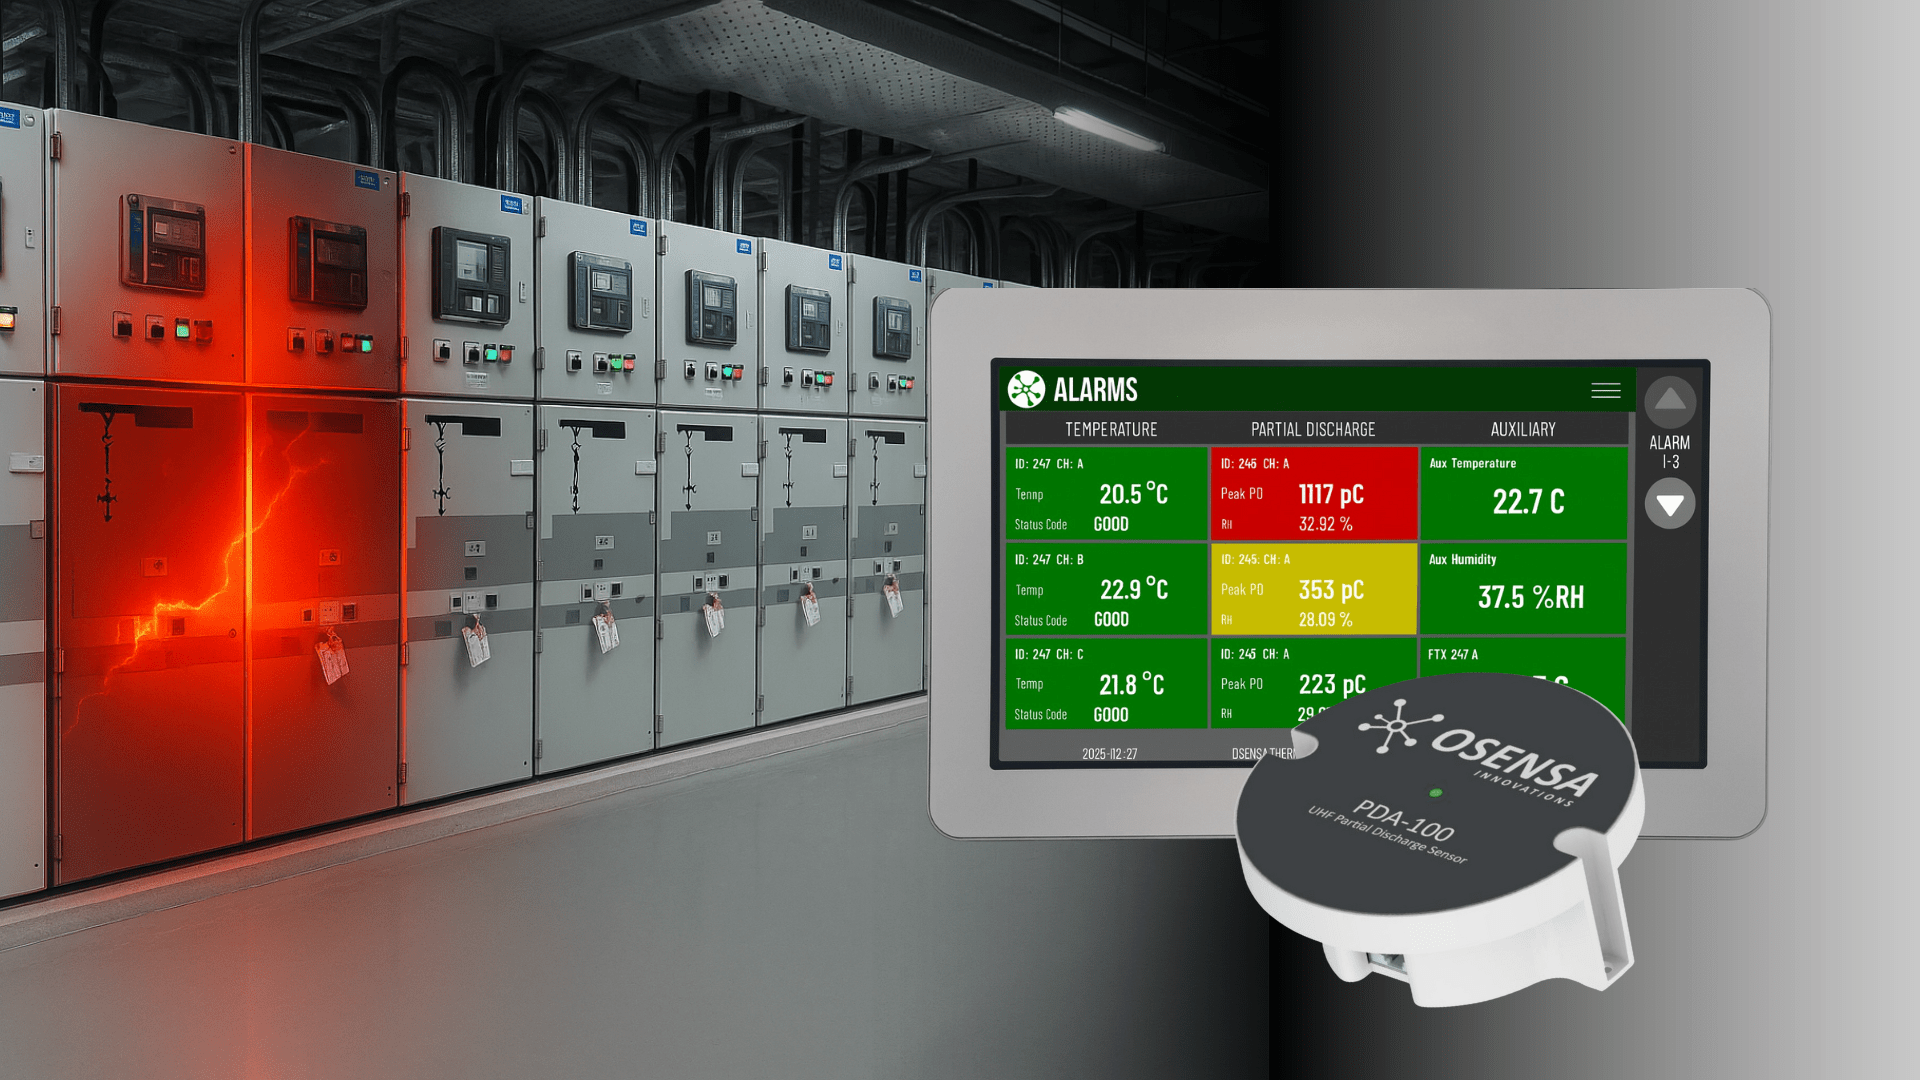
The HMI-001 gives operators instant visibility into PD levels, temperature, humidity, and alarms—putting all critical diagnostics in one place
OSENSA’s monitoring platform provides deep diagnostic insights into partial discharge behavior, helping maintenance teams understand not just that PD is occurring — but what kind of PD is developing and how fast it is progressing.
The system records partial discharge activity continuously. Using OsensaView software, engineers can generate Phase-Resolved Partial Discharge (PRPD) cloud plots, which reveal:
PD presence and intensity
The affected phase
The pattern type (voids, surface tracking, corona, treeing)
Each pattern acts as a diagnostic fingerprint, enabling early identification of insulation issues long before failure symptoms appear.
Including real cloud plot images (like yours from 15:00–18:00) shows how PD evolves over time and greatly strengthens the technical credibility of your blog.
This comprehensive analysis helps engineers plan maintenance proactively and avoid unnecessary downtime.
The PRPD timeline from 15:00 to 18:00 shows a consistent increase in PD magnitude and pulse density—clear evidence of a developing insulation defect that is becoming progressively more active
4. Optional: Fiber Optic Thermal Monitoring
One of OSENSA’s major strengths is the ability to combine UHF partial discharge monitoring with fiber optic temperature sensing to give a complete picture of asset health.
PRB-110 & PRB-910 Fiber Optic Probes
These probes are designed for direct installation on energized components and offer:
High-voltage rating up to 38 kV (safe for direct busbar contact)
Multi-point temperature sensing (3–9 sensors per transmitter)
Complete immunity to electromagnetic interference
Continuous hot-spot monitoring of busbars, terminations, joints, and cable connections
Why Combine PD + Thermal?
Partial discharge and overheating are two of the biggest indicators of insulation failure. When monitored together, they provide far clearer diagnostics.
Example:
PD starts increasing → Insulation is degrading
Temperature rises at a joint → Resistive heating from a loose or corroded connection
Individually, each symptom could be misunderstood or ignored. Together, they form a high-confidence early warning of imminent failure.
PD + Thermal = The most reliable way to predict failures before they happen.
Fiber-optic thermal probes installed directly on busbars and joints provide continuous hot-spot monitoring—perfectly complementing UHF PD detection for a complete reliability picture.
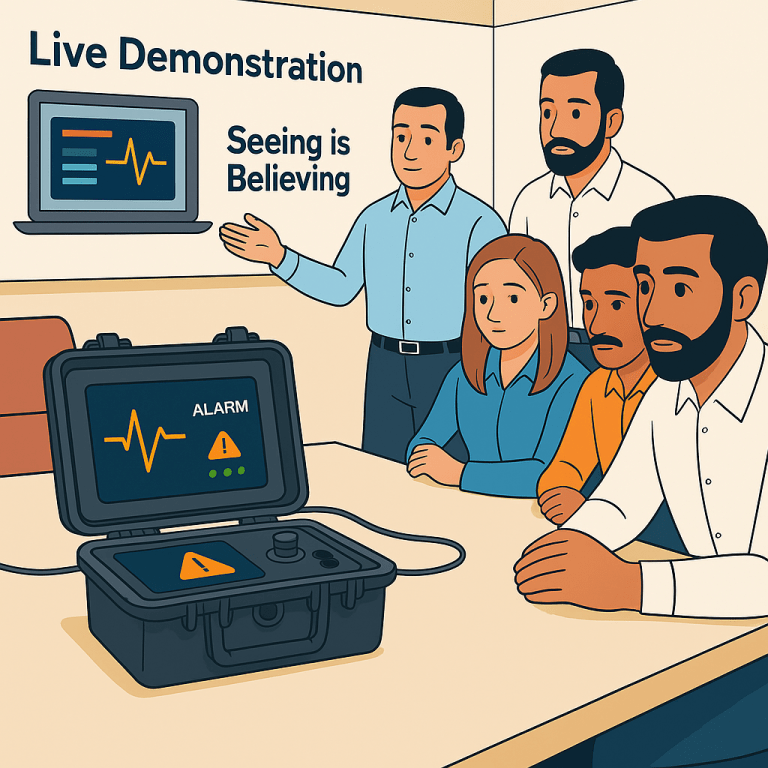
Live Demonstration: Seeing is Believing
We Prove It Before You Invest
At Petrozone, we don’t ask you to take our word for it. We bring our demonstration equipment directly to your facility and show you exactly how partial discharge detection works—live, in real-time, before you make any commitment.
What Happens During Our Live Demonstration:
Our engineer arrives with a complete, portable demonstration system. In front of your team, we’ll create controlled partial discharge activity and show you instant detection on the monitoring display. You’ll watch as:
Real PD signals are generated using our calibrated simulator
The system detects immediately – electromagnetic bursts captured in microseconds
Data appears on screen in real-time – peak discharge values, activity levels, and trending
Alarm thresholds activate – demonstrating how your team would be alerted to developing problems
Phase-resolved patterns display – showing the diagnostic “fingerprint” that identifies fault types
The demonstration takes 30-45 minutes and can accommodate your entire maintenance and engineering team. You’ll see with your own eyes how the technology catches problems that traditional testing methods miss entirely.
Why This Matters:
PD monitoring sounds complex. Our live demonstration makes it simple and tangible. You’ll understand exactly what you’re getting, how it works, and why it’s so effective—all before signing anything.
No sales pressure. No technical jargon. Just proof that the technology works exactly as promised.
Your Insulation is Trying to Tell You Something. Are You Listening?
Every partial discharge is a cry for help. With continuous UHF monitoring, you’ll hear it in time.
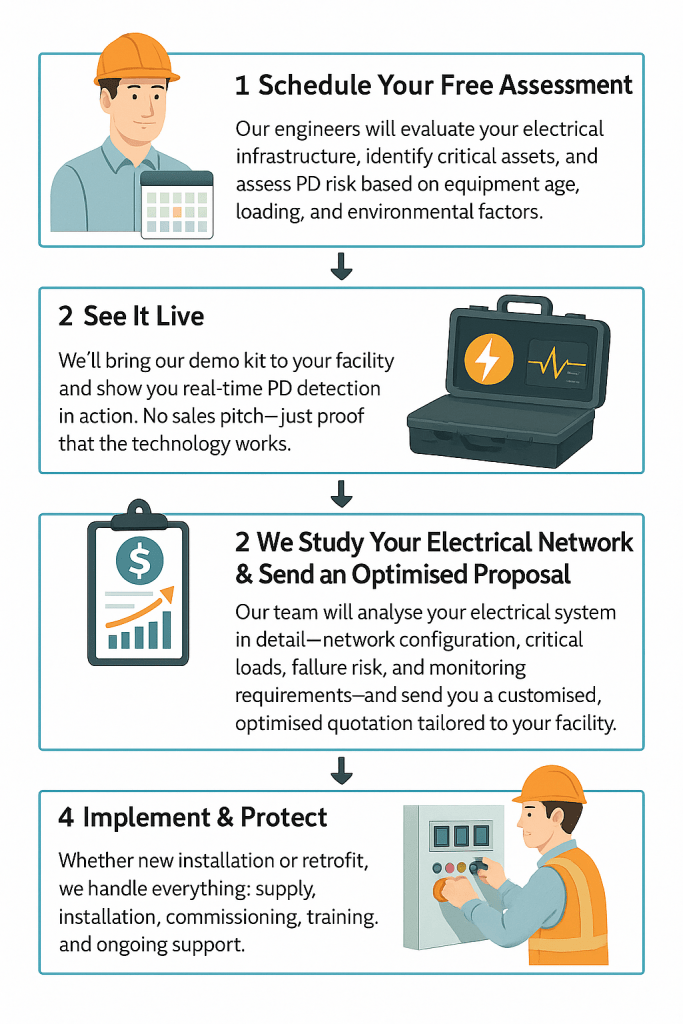
Take Action Today!
Proactive maintenance is no longer optional—it’s the only way to prevent unexpected breakdowns, costly outages, and safety risks in today’s high-demand electrical environments. With continuous online Partial Discharge (PD) monitoring, you gain real-time visibility into the health of your switchgear, transformers, and critical assets. Our process is simple, transparent, and engineered to help you make informed decisions with zero guesswork.
Yes, absolutely. Sensors can be installed in RMUs, MV/LV switchgear, and GIS systems without replacing equipment. Installation can even be performed on energized equipment in most cases.
Generally no. Sensors are mounted externally or in accessible compartments and can be installed while the system remains energized. However, safety assessments are performed case-by-case.
Extremely accurate. The system detects PD down to 50 pC and provides phase-resolved cloud plots that correlate PD activity with the AC voltage cycle, enabling precise fault type identification and location.
Because switchgear compartments act as Faraday cages, each compartment requires its own sensor for accurate detection. This means a complete installation may require multiple sensors (typically 2-6 per switchgear bay depending on configuration).
Yes. The system supports industry-standard protocols: Modbus RTU, Modbus TCP/IP, IEC 61850, and DNP3, ensuring seamless integration with virtually any control system.
Because combining both provides a complete diagnostic picture. PD indicates insulation degradation; thermal monitoring detects resistive heating. Together, they reduce false alarms and improve accuracy in predicting failures.
For critical assets, payback often comes from preventing a single unplanned outage. Typical ROI is 1-3 years depending on downtime costs and asset criticality.
Yes. While this article focuses on switchgear, OSENSA’s UHF technology is also effective for bus ducts, dry-type transformers, and cable systems (with appropriate sensor selection).
Petrozone International’s certified technicians handle all installation, commissioning, baseline establishment, SCADA integration, and training. We provide complete turnkey solutions with full after-sales support.
PD monitoring complements your preventive maintenance schedule. It doesn’t replace inspections—it makes them more targeted and effective by telling you exactly which assets need attention and when.
We provide detailed ROI calculations specific to your facility, including downtime cost analysis, risk assessment, and payback projections. Most approvals come quickly when the cost of one prevented failure exceeds the entire system investment.
Related Links & Further Reading
Looking to explore more about our services and expertise? Check out the following pages:
🔗 Cable Termination Services– Discover how we handle MV cable terminations with precision and reliability. 🔗 Erection & Installation – Learn more about our process for safely installing electrical equipment and infrastructure. 🔗Testing & Commissioning– Explore our comprehensive testing protocols that ensure safe energization. 🔗 Contact Us– Got a similar project? Reach out to us today and let’s get it done, the Petrozone way.